Tricks for Using the JavaScript Console

If you are new to Javascript, chances are you are usingconsole.log() to debug your code like it’s going out of style, which is a great first step! But did you know that there is more to console that meets the eye? Below are a few helpful hints on how to take your debugging skills to the next step.
Trick #1: Adding Text as an Argument
When I first got a handle on how to use console.log(), I was cautious and used it only to check newly created variables or objects in my code. As I grew more confident, I began sprinkling console.log() everywhere but it quickly became confusing to distinguish what was being called where. One trick to help you distinguish where you are calling yourconsole.log() is to pass in text as the first argument. I personally like to note what function my console.log() is in so I can confirm that it is firing as expected. If I manage to write long, complicated functions, I also like to pass in previously declared objects to ensure that they are in scope. This helps to cut down on repetitive logic and keep my code D.R.Y. (stands for Don’t Repeat Yourself).


Keep in mind that console.log() will print the elements passed in an HTML-tree format. This is a great way to narrow the scope of the DOM and zero in on what you are looking for.
Trick #2: One Log to Test Them All
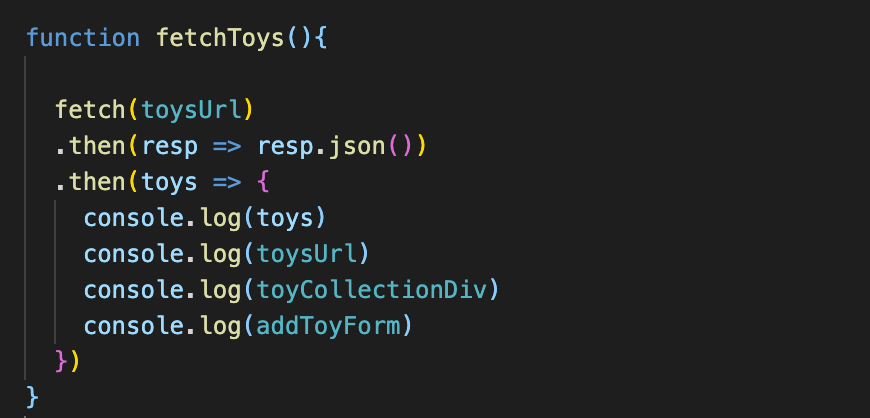
If you find yourself using console.log() multiple lines in a row, like in the code above, consider wrapping them all up in a single log.

The beauty of console.log() is that it can take in multiple arguments so you can spend more time debugging and less time typing. If adding everything to a single console.log() gets too confusing, consider passing your elements in as an array with text to separate things a bit in the console.


Check out the MDN web docs for more details on the console.log() syntax and use.
Trick #3: To Log, or Not to Log…
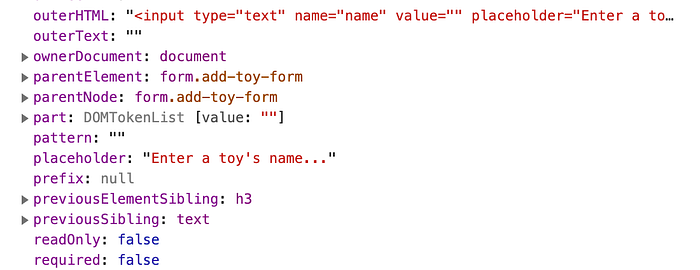
Using console.log() liberally will always be a tremendous help, but sometimes you just need to dig a little deeper, especially if you are aiming to manipulate or traverse the DOM. This is where console.dir() comes it. Like console.log(), console.dir() will print information to your console, but it will provide you with an extensive, JSON-like interactive list of properties associated with the HTML element that was passed. For example, if you wanted to see more information about a div in your document, passing it through console.dir() will allow you to view details such as that div's inner text, tag name, inner/outter HTML, dataset information, family structure, including children, parents, sibilings, etc.
Trick #4: Putting it All on the Table
If you are dealing with large arrays or nested objects in Javascript, it can be increadibly frustrating to look through them in the console if you used console.log(). You either have to click various discolsure triangles to find what it is you are looking for or need to scan carefully through a seemingly endless wall of text just to get a handle on what the data is telling you.
A simple solution to this is another console method called console.table(). This method will take in objects or arrays and display them in an easy to read table that is also sortable! To sort the data, simply click on the column header and it will reorganize in either ascending or descending order.
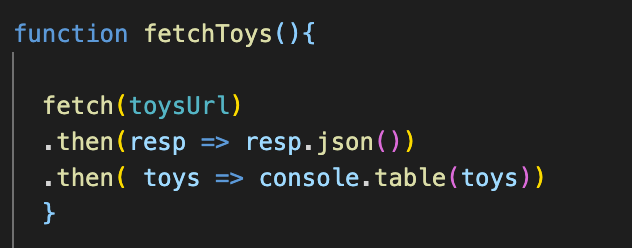

This makes debugging large collection of data more tollerable and skimming incoming data from an API pleasurable.
If you happen to pass through an object and not an array, you’ll notice that the (index) will populate with the keys of the object rather than the ascending list of index numbers.
These are just a handful of helpful console tricks that have made debugging my JavaScript code a little bit easier and more efficient. For more information on the various methods available for the console, check out the MDN web docs.
If you have mastered the art of the console and are ready to take your debugging skills to the next level, check out Chrome’s DevTools tutorials for JavaScript.
